Cumulative graphs in Prometheus
Posted on Sun 16 August 2020 in monitoring
I've been experimenting a bit with Prometheus and Grafana. It allows you to make beautiful graphs from the metric data using relatively simple expressions. But one of the graphs that I had in mind, turned out to be more difficult. These are my notes.
I have a metric that counts the electrical energy my solar panels have produced: energy_out_watthour_total.
(There is some debate whether watthour is "right". Some people argue that it should be Joules, but that is not the point of this post.)
Since this is a counter (_total suffix), Prometheus does all the magic to compensate if this counter would reset to zero.
This also means that the absolute value of the counter is irrelevant, only the changes are meaningful.
If you are only interested in the changes, rate(metric) will give you exactly that:
it will calculate the rate of change (for this case, this will yield the average power in Watt between every two datapoints).
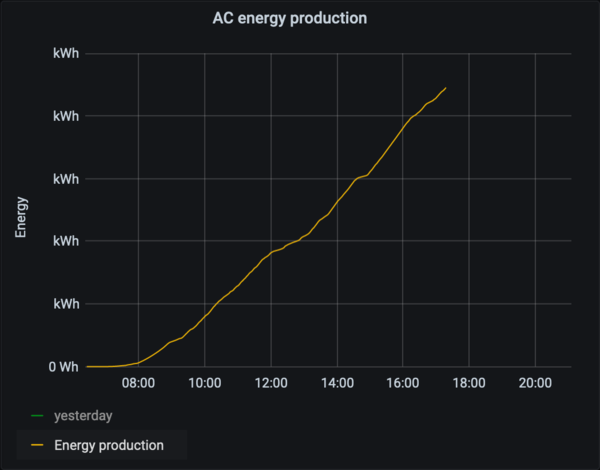
But I wanted a cumulative view: how much energy have I produced over this day, this week, ...
For a given day, this give a sigmoid-like curve:
(I have removed the actual values for privacy)
The corresponding power-graph looks like this:
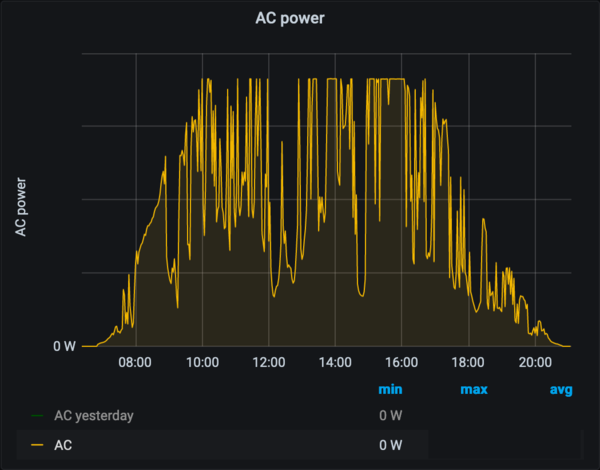
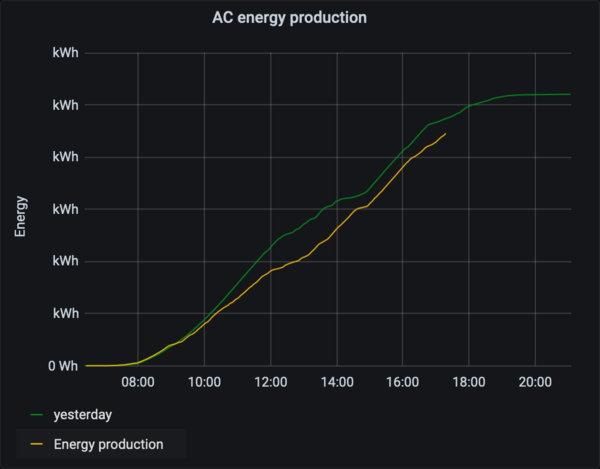
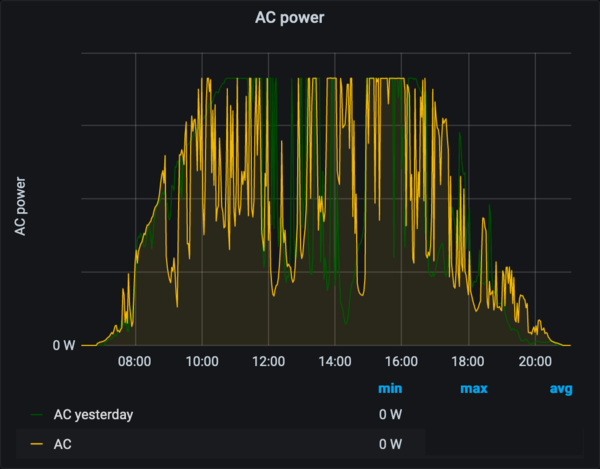
Both graphs show the same information, and for a single day, they don't differ much. But when comparing e.g. today to yesterday, I find a cumulative view much easier to read: are we ahead/behind "schedule" compared to yesterday? Especially when the power is very spikey, I find cumulative graphs much easier to interpret. Take a look for yourself:
PromQL
Next up: getting this idea of a cumulative graph translated into a Grafana dashboard.
The basic idea is not too hard. I want to plot energy_out_watthour_total - ${energy_out_watthour_total_at_the_beginning_of_this_graph}.
Turns out that last part isn't so easy:
There is no easy way to have Grafana query Prometheus for the value at a particular point in time.
Or, at least I didn't find that way.
So I reached out to the #prometheus IRC channel on FreeNode. With the help of SuperQ and roidelapluie, we figured out some tools to help us:
Grafana exposes a few variables that you can use inside your query.
Especially the $__from variable looks interesting for this case.
Next, we figured out a few ways that didn't work:
-
metric_total - metric_total offset (time() - $__from)doesn't work, since offset requires a constant offset, not something dynamic -
scalar(metric_total and on() time() == vector(1597579200))doesn't work for multiple reasons: you'd need to get the timestamp exactly right, or use a range that covers exactly 1 datapoint. And, since prometheus only evaluates the metrics within the time window that is it about to graph, this may yield no points at all if hte timestamp is outside that range.
What does work is this construction:
metric_total
- max_over_time(
  (
    metric_total and on() vector(time()) < $__from/1000
  )[${__range_s}s:$__interval]
)
The inner and construction gives the metric up until the start of the graph.
The range vector selection allows us to gather up data from before the start of the graph.
The actual values are less important, as long as it scoops up at least one datapoint.
The max_over_time() takes the highest value it sees. Since this is a counter,
this effectively means taking the most recent value.
There is an edge case when a reset occurs within this window. We can solve that by using
metric_total
- avg_over_time(
    (
      metric_total and on() vector(time()) >= $__from/1000 < $__from/1000+$__interval_ms/1000
    )[${__range_s}s:$__interval]
  )
This narrows the time-frame that is considered, and uses avg_over_time() to average out the remaining points.
Hopefully, there will only one point.
The downside of this expression is that it doesn't work for my solar production:
during the night, the invertor goes into a sleep-state, and I can't get any metrics from it.
This means that, depending on the actual time-window of the graph, the start-time may have no data, failing the query.
Grafana
I've struggled a bit on the finishing touches in Grafana, so I'll note them down here as well.
Since solar panels only work during daylight, it makes no sense to waste space on the night hours.
I found that plotting from now/d+5h to now/d-90m works best for my location.
This plots the current day from 05:00 until 22:30 (local/browser time).