In Search for a new Monitoring Solution
Posted on Sat 07 January 2023 in linux
I'm currently running all of my monitoring through Prometheus, backed with InfluxDB for the long-term storage of selected metrics. But recently, I've been limited in functionality when creating graphs in Grafana. And although I like Prometheus, it looks like my use-case is outside the domain of Prometheus.
Use Case
I want to monitor my home's energy consumption throughout the year. The metrics I have available are:
-
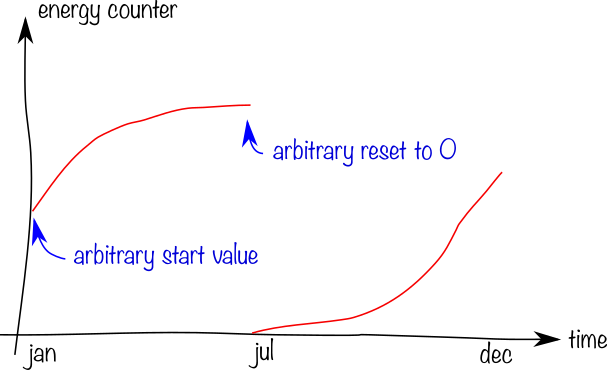
An energy counter for gas, updated every few minutes. Since these are counters, they may reset to 0 at any time, and this should be accounted for when graphing.
-
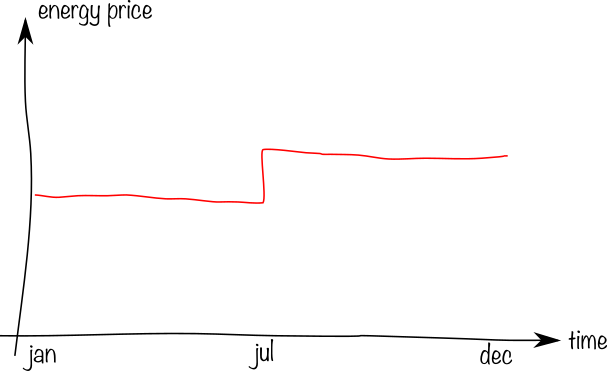
The energy price. This metric is not known real-time, and is very coarse: 1 datapoint per day. Depending on the contract, it may be known up to 3 months in advance, or only 1 month after the consumption.
I would like to create the following graphs:
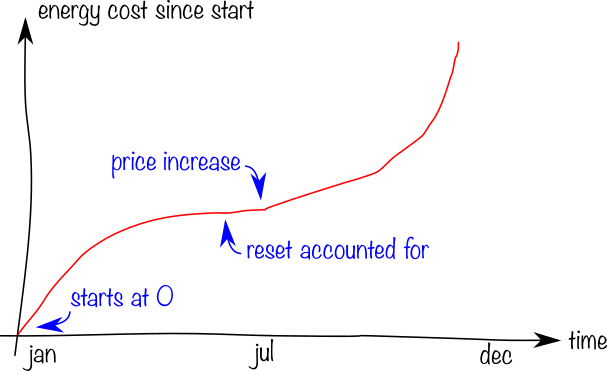
To make this graph, I need several features from the time series database:
- Handle counter resets correctly.
- Calculate back-and-forth between the cumulative counter and the derived rate: To convert from energy to price, the current unit price needs to be applied to the marginal usage in the corresponding time period. You can't just multiply the counter value with the price as that would create a discontinuity.
- Be able to draw cumulative/running sums. I.e. start at zero at the left edge.
Prometheus
Since Prometheus is my current monitoring solution, I first tried to get it working with Prometheus. I covered the cumulative part of the problem before. That solution can't handle counter resets, but the biggest hurdle is incorporating the price: it seems that there is no way to have Prometheus calculate a cumulative sum.
InfluxDB
Since I'm already using InfluxDB as long-term storage anyway, the next logical step was to skip Prometheus and interact directly with InfluxDB. I'm fairly new to the Flux language, but the query below seems to give the results I want:
import "date"

earlyStartTime = date.sub(d: 1d, from: v.timeRangeStart)
// Make sure we have the previous gas_price in range.
// gas_price is update (at least) once a day

from(bucket: "default")
  |> range(start: earlyStartTime, stop:v.timeRangeStop)
  |> filter(fn: (r) =>
    (r._measurement == "gas" and r._field == "volume_m3") or
    (r._measurement == "gas_price" and r._field == "price_EUR_per_m3")
  )
  |> group()  // join series into a single table for pivot
  |> pivot(rowKey: ["_time"], columnKey: ["_measurement"], valueColumn: "_value")
  |> sort(columns: ["_time"])
  |> fill(usePrevious: true, column: "gas_price")  // fill in missing gas_price
  |> difference(nonNegative: true, columns: ["gas"])  // convert to per-sample difference, nonNegative detects resets
  |> range(start: v.timeRangeStart, stop:v.timeRangeStop)  // crop to actual requested range after fill (to have price info)
                                                           // and difference (to have data for the first point)
  |> map(fn: (r) => ({_time: r._time, _value: r.gas * r.gas_price}))
  |> aggregateWindow(every: v.windowPeriod, fn: sum, createEmpty: false)  // We no longer need dense data at this point
  |> cumulativeSum()